
The 2026 midterm elections fall on Tuesday, 3 November 2026, with all 435 House seats and 35 Senate seats on the ballot. Traders should prepare for these midterms by anticipating pre-election market choppiness, followed by a potential rally once the results clarify which party controls Congress and the subsequent path of taxes, spending, and regulation.
This guide covers how the midterms work, how markets reacted in 2018 and 2022, and how traders can position their portfolios for 2026.
Key Takeaways
|
What Is a Midterm Election?
A midterm election is a US federal election held two years into a president’s term, with no presidential race on the ballot. Instead, it decides which party controls Congress.
Congress has two chambers, and the midterms reshape both:
- House of Representatives (House): 435 members serving two-year terms, so every seat is contested at each midterm. A party needs 218 seats for a majority.
- Senate: 100 members serving staggered six-year terms, so about one-third of seats are up for election in each election cycle. A party needs 51 seats, or 50 plus the vice president’s tie-breaking vote.
Most states also elect governors, state lawmakers, and local officials on the same day.
What Is the Exact Date of the 2026 Midterm Elections?
The 2026 US midterm elections are on Tuesday, 3 November 2026. Federal law fixes Election Day as the Tuesday after the first Monday in November.
On the ballot for the 2026 midterm elections:
- All 435 House seats, plus five of the six non-voting delegate seats.
- 35 Senate seats: 33 regularly scheduled seats plus special elections in Florida and Ohio to fill the seats vacated by Marco Rubio and J.D. Vance.
- 36 state governorships, along with many state legislative, local, and ballot-measure votes.
State primaries were held on different dates, but the general election takes place on one day nationwide. Close races may take days to call, and winners take office in January 2027.
What happened to the markets after the US Midterm Elections?
Markets usually improve as uncertainty fades. According to Capital Group, the S&P 500 has been higher in the 12 months after every midterm since 1950, gaining about 15% on average, regardless of the party in power.
The 2018 and 2022 midterms show how this pattern plays out, and how inflation and central bank policy can still override it.
How Did Markets Perform After the 2022 Midterm Elections?
The S&P 500 gained 14.5% in the year after the 2022 midterms, in line with the historical pattern. The biggest early move came two days after the vote, when a cooler-than-expected US inflation report on 10 November 2022 sent the index up about 5.5% in a single session.
Other markets were driven mainly by easing inflation and the collapse of the FTX crypto exchange the same week.
| Product | 1-month | 3-month | 1-year | Reason for move |
|---|---|---|---|---|
| S&P 500 | +3.5% | +7.6% | +14.5% | Rallied on cooler inflation, then entered a new bull market in 2023. |
| US 10Y Treasury yield | -66 bps | -51 bps | +35 bps | Fell as cooling inflation eased Fed-hike fears; higher a year later as rates stayed high. |
| USD Index (DXY) | -4.4% | -5.7% | -3.7% | Weakened as softer inflation cut rate-hike expectations. |
| Gold | +5.0% | +10.2% | +14.1% | Rose as the dollar and real yields fell. |
| WTI Oil | -19.7% | -11.6% | -14.6% | Fell on global growth worries and weak Chinese demand. |
| Bitcoin | -7.2% | +23.8% | +91.7% | Fell after the FTX collapse, then rebounded strongly in 2023. |
How Did Markets React After the 2018 Midterm Elections?
The S&P 500 rose 2.1% the day after the vote, then slid in a sharp fourth-quarter sell-off driven by Fed rate hikes and the US – China trade war, suffering its worst December since 1931. After the Fed signaled a pause in early 2019, the index recovered to finish 11.7% higher a year later.
Growth worries also pushed investors toward safe havens such as gold and Treasuries.
| Product | 1-month | 3-month | 1-year | Reason for move |
|---|---|---|---|---|
| S&P 500 | -2.2% | -0.9% | +11.7% | Fell in the Q4 sell-off, then recovered after the Fed paused in 2019. |
| US 10Y Treasury yield | -35 bps | -52 bps | -141 bps | Fell as growth worries raised expectations of a Fed pause. |
| USD Index (DXY) | +0.5% | +0.1% | +1.7% | Roughly flat: Fed hikes offset slowing global growth. |
| Gold | +1.2% | +7.0% | +21.8% | Rose as yields fell and safe-haven demand grew. |
| WTI Oil | -17.1% | -13.2% | -9.7% | Fell on oversupply, record US output, and Iran sanctions waivers. |
| Bitcoin | -46.8% | -47.8% | +44.9% | Fell in the post-2017 crypto bear market, then recovered in 2019. |
How Could the 2026 Midterm Elections Affect Financial Markets?
The 2026 midterms will likely move markets based on the balance of power in Congress, not on which party wins, because divided control tends to stall major tax and spending changes.
As of October 22, Polymarket’s prediction markets indicate a 92% probability of Democrats winning control of the House in the US midterm elections. Meanwhile, Republicans have a 35% probability of retaining their Senate majority, suggesting a more competitive race for the upper chamber.
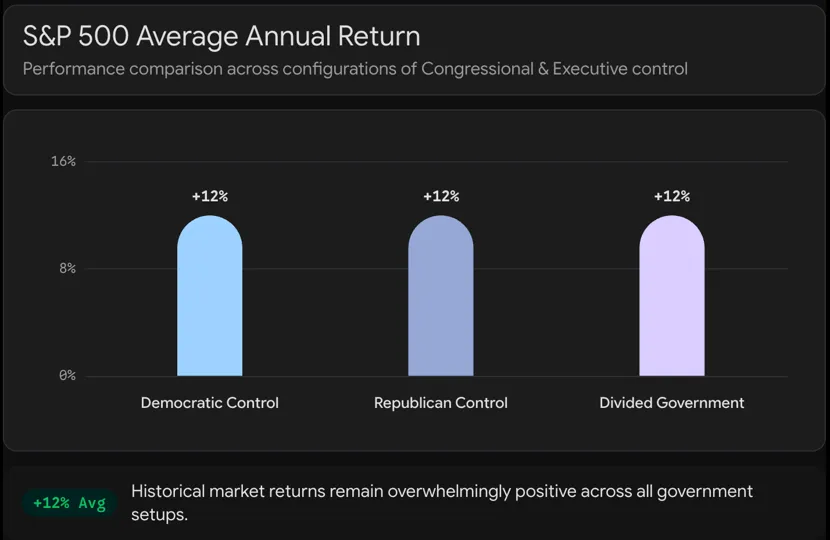
Investors should be cautious about assuming one political outcome is inherently better for their portfolios. Historical data show that no single party or configuration of control has consistently delivered stronger long-term returns. While divided government can reduce legislative disruption, full control by either Democrats or Republicans has also historically resulted in positive market performance.
How Could the 2026 Midterm Elections Affect the S&P 500?
S&P 500 Index performance often sees heightened volatility in the months leading up to November; post-election clarity has historically triggered a relief rally across broad-market equities, regardless of the winner.
Since 1950, the S&P 500 has risen in the 12 months following every midterm election. But the 2026 outlook was shaped far more by Federal Reserve interest rate policy and corporate earnings than by political control.
The midterm election outcome may matter more for individual sectors than for the index as a whole:
- Healthcare: debates over drug pricing and insurance subsidies could return if Democrats win a chamber.
- Defense: enjoys support from both parties, so it is often resilient under a divided government.
- Financials and energy: sensitive to whether deregulation and production-friendly policies continue.
- Clean energy: federal support could stay limited, or return to debate if control shifts.
- Technology: driven more by AI investment and earnings than by elections, though concentration risk is high.
Bigger macro forces are also at play. The Federal Reserve raised rates to 3.75% – 4.00% on 16 September 2026, its first hike since 2023, and signaled that another may follow. As in 2022, inflation data and Fed decisions could outweigh the vote itself.
Register to get the full Q4 Market Outlook report
How Could the Midterm Elections 2026 Affect the US Dollar?
For the dollar, midterm elections act as a secondary driver compared with Federal Reserve interest rates. Because higher rates widen the dollar’s yield advantage, central bank policy tends to override political outcomes. This dynamic was clear in the last two midterm cycles, where the US Dollar Index moved in opposite directions, rising 1.7% in the year following 2018, but falling 3.7% in the year after 2022
The election could still matter through two channels:
- Fiscal policy: a divided government would make large new spending or tax-cut packages less likely, which could ease concerns about US deficits.
- Brinkmanship risk: divided control raises the chance of funding and debt-ceiling standoffs, adding volatility to Treasuries and the dollar.
Which Currency Pairs Are Most Sensitive to the 2026 Midterm Elections?
The following scenarios outline how selected currency pairs could respond to developments surrounding the 2026 US midterm elections. These projections are based on potential shifts in market sentiment, US fiscal and trade policies, and interest rate expectations. Actual market movements may differ depending on election outcomes, economic conditions, and other external factors. The scenarios are for informational purposes only and should not be interpreted as trading recommendations.
| Currency pair | Why it may react |
|---|---|
| USD/CNH | USD/CNH may be capped as doubts about the dollar’s credibility and political instability in the US government administration lift the RMB, but after the election, the debt ceiling, fiscal gridlock, and trade tensions could drive USD/CNH higher. |
| USD/CAD | USDCAD is expected to drift lower before the election on CAD strength from firm oil prices and USD credibility risk, then rebound modestly after the election as US yields rise and trade tensions weigh on Canada, though gains are capped by oil support. |
| USD/JPY | USDJPY is expected to drift lower before the election as political uncertainty dampens USD’s safe‑haven appeal, then rebound afterwards if US yields rise on fiscal gridlock, though volatility remains high given Japan’s yield‑sensitive currency profile. |
| EUR/USD | EURUSD is likely to rise into the 2026 US midterms on dollar governance-risk concerns, then face limited downside after the election as higher US yields may support the USD, ultimately leaving the pair caught between the US rate advantage and the euro’s “reserve alternative” hedge appeal. |
Currencies trade on expectations, so these pairs can move as election odds change, not only after the result is known.
How Should Traders Prepare for the Midterm Elections 2026?
Traders can prepare for the 2026 midterms by mapping key dates, expecting higher volatility, and planning for multiple outcomes. The weeks around the vote are packed with market-moving events:
| Important Date | Event | Why it matters |
|---|---|---|
| 27 – 28 October 2026 | Federal Reserve policy meeting | A rate decision six days before the vote, with markets debating another hike. |
| 3 November 2026 | Midterm Election Day | Results for close House and Senate races may take days to confirm. |
| 8 – 9 December 2026 | Federal Reserve policy meeting | Includes updated rate projections after the election. |
Monthly inflation and jobs reports also matter: In 2022, an inflation report two days after the vote moved markets more than the result. (Please visit our economic calendar for more details.)
A few practical steps can help:
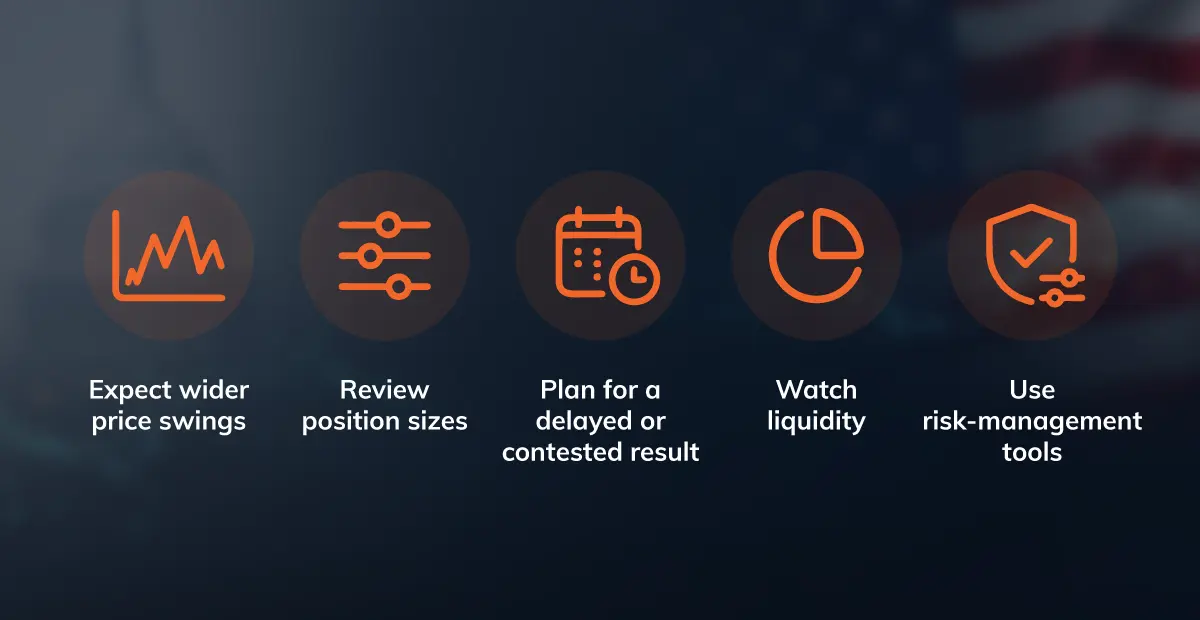
- Expect wider price swings. Volatility often rises into Election Day, then falls once results are known.
- Review position sizes. Larger swings mean the same position carries more risk than usual.
- Plan for a delayed or contested result. Close races, recounts, or runoffs can keep uncertainty high for longer.
- Watch liquidity. Spreads can widen around major releases and overnight as results come in.
- Use risk-management tools. Stop-loss orders can limit losses, though they may not protect against gaps in fast markets.
What Trading Strategies Do Traders Use Around Election Volatility?
Traders managing election volatility typically choose between five core strategies: waiting for confirmation, hedging existing positions, trading volatility rather than direction, rotating sectors, and trading currency reactions, each carrying distinct trade-offs:
- Waiting for confirmation: staying on the sidelines until the result is clear avoids pre-election swings but may miss part of any relief rally.
- Hedging existing positions: tools such as index options can protect a portfolio through the event, but hedges cost money.
- Trading volatility, not direction: straddles and strangles aim to profit from a large move either way, but a post-event “volatility crush” can cause losses even if the market moves.
- Sector rotation: shifting toward sectors such as healthcare or defense requires predicting both the outcome and the policy response.
- Trading currency reactions: some traders focus on trade-sensitive pairs such as USD/CNH and USD/CAD, or on the safe-haven yen.
Whatever the approach, past midterm patterns do not guarantee future results. Inflation, central bank policy, and unexpected events have often mattered more than the vote itself.
How Can Traders Use CFDs Around an Election?
Traders can apply the strategies above using different financial instruments. For traders looking to respond to short-term price movements, contracts for difference (CFDs) are one option. CFDs allow traders to take positions in both rising and falling markets without owning the underlying asset.
Here are four ways traders may use CFDs around election-related volatility:
- Breakout Trading: Instead of predicting the winner, traders can wait for prices to break above resistance or below support as election results become clearer, then consider trading in the direction of the move.
- Trade Policy-Sensitive Sectors: Election outcomes can change expectations for energy, financials, healthcare and clean energy. Traders may use CFDs to take positions in markets affected by potential policy changes, although the expected winners do not always rise.
- Hedge Existing Positions: Investors holding stocks may consider a short index CFD position to help offset some losses if markets fall. However, the hedge may not fully match the portfolio and can create additional costs and risks.
- Trade a Post-Election Relief Rally: Once results become clearer, uncertainty may ease and markets could recover. Traders may wait for stronger momentum or a break above resistance before considering a long position.
Regardless of the approach, election volatility can cause sharp price swings, wider spreads and slippage. Because CFDs are leveraged products, both gains and losses can be amplified. Position sizing and risk management remain essential.
Final Summary
The 3 November 2026 US midterms may move markets by changing expectations for taxes, spending and regulation. However, inflation and Federal Reserve policy can outweigh election results. Traders should prepare for different outcomes, wait for price confirmation and manage risk carefully, especially when using leveraged CFDs.